Ufuk CEYHANLI
December 26, 2020
Insights to Food Prices in Czech Republic by using Tableau
It’s beeen only three weeks to move to Prague, however, I’ve become very familiar with the prices in the supermarket. In this study, I’ll give insights of the food prices in Czech Republic by using one of the most efficient softwares for analytics, Tableau. Here is the summary of the study.
- Obtaining the price data from czech statistic office.
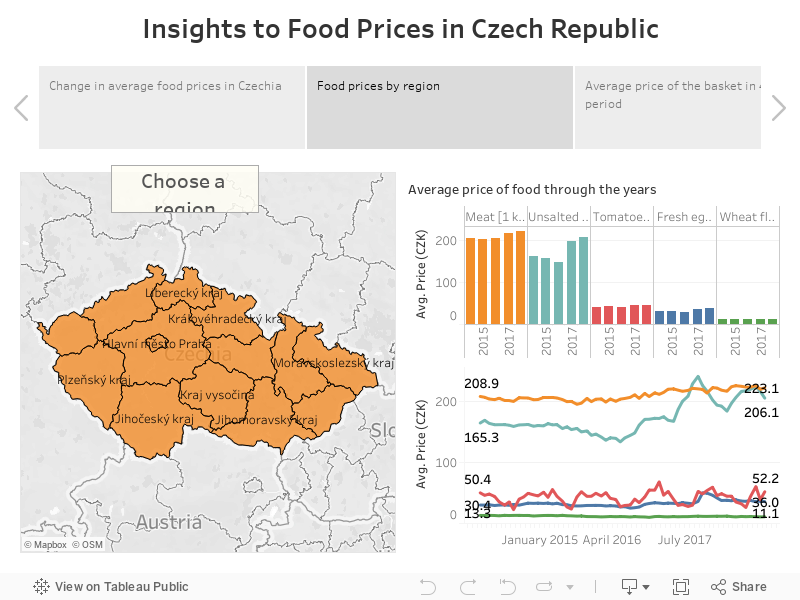
- Examining the change in the prices for selected foods through out the years 2014-2019
- Creating a dashboard for you interact with the graphs and charts.
- Creating a shopping basket containing 1kg meat, 1kg butter, 1kg tomotaes, 10 pieceses of eggs and 1kg wheatflour.
- Comparing the prices of the shopping basket based on the regions.
- Checking how many baskets can be affordable for a person with minumum wage through the years.
Here is the dashboard.